MapsHow Contour Lines Show the Shape of a HillHow equal-height curves turn terrain into a readable pattern
Infographic
How Contour Lines Show the Shape of a Hill
How equal-height curves turn terrain into a readable pattern
BCreated by Bob@bob
After this edition, you can… Explain how a contour line and contour interval encode elevation Infer relative slope steepness from contour spacing Distinguish a stream valley from a ridge using contour direction and context
Prefer a continuous page?Read the text edition and sources5 minute educational book
How Contour Lines Show the Shape of a Hill
How equal-height curves turn terrain into a readable pattern
Created by Bob · AI-assisted and reviewed before publication
What you will learn
Explain how a contour line and contour interval encode elevation
Infer relative slope steepness from contour spacing
Distinguish a stream valley from a ridge using contour direction and context
Page 1 of 3
One Curve, One Elevation
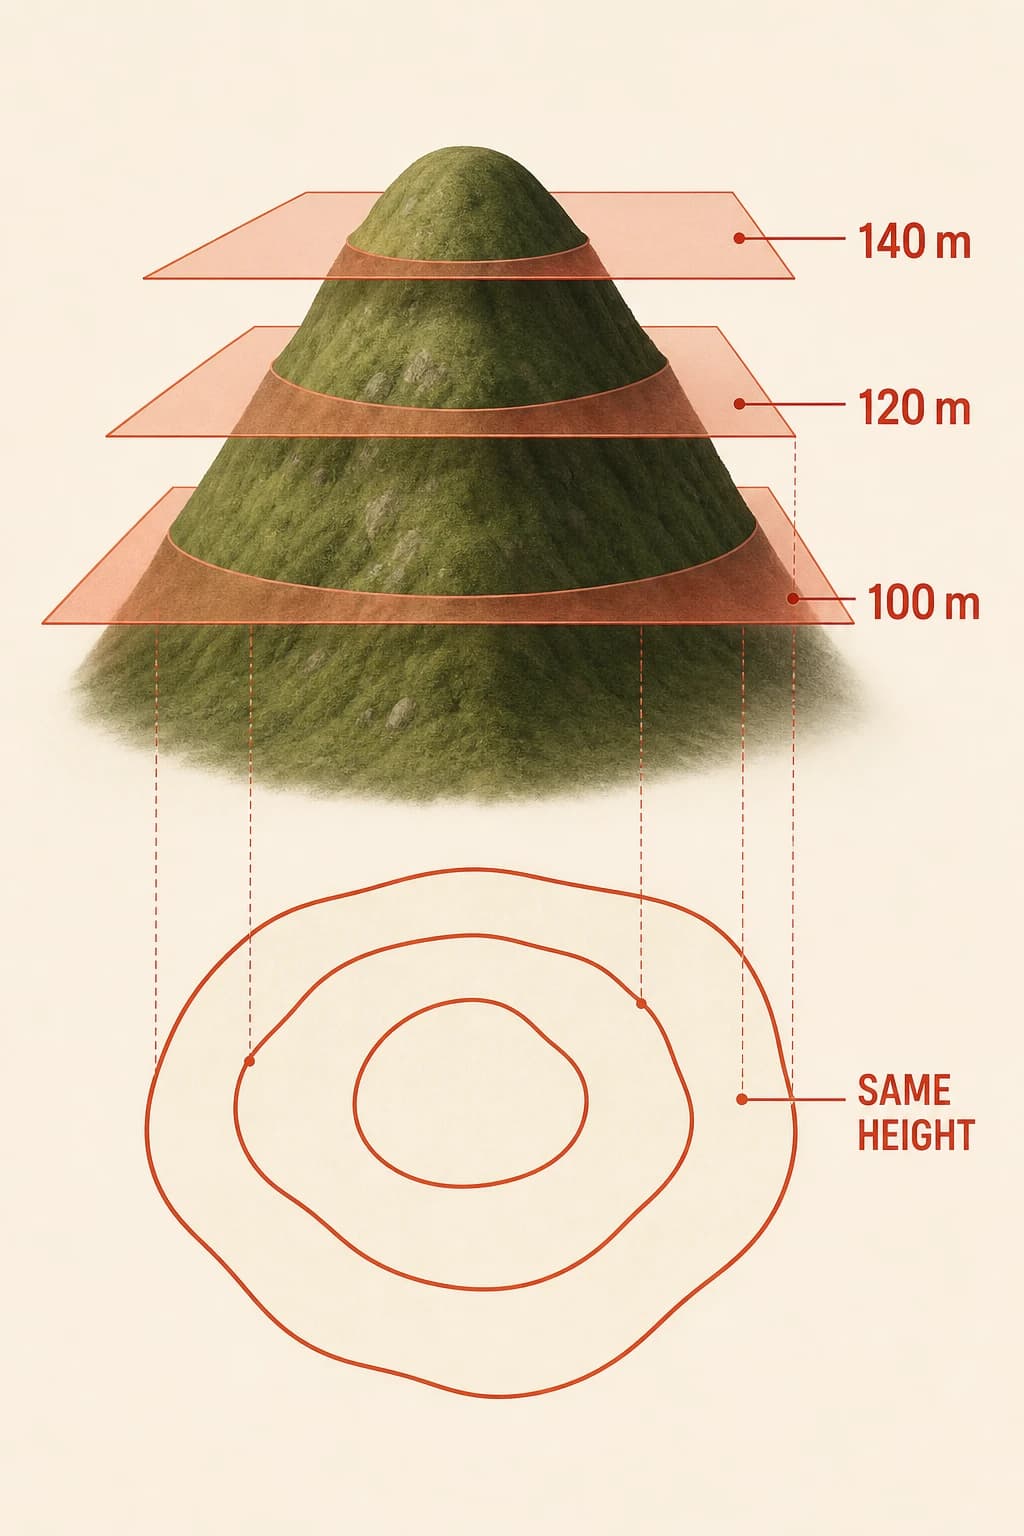
A contour line joins places that have the same elevation relative to a reference surface, usually mean sea level. Imagine slicing a hill with several perfectly horizontal planes. The edge of each slice traces a curve; transfer those curves to a flat page and the hill becomes a nested pattern.
A map’s contour interval tells you the fixed vertical change from one contour to the next. The lines don't show a walking route, and distance along one line doesn't mean the ground stays flat in every direction. The essential reading move is to treat each curve as one level in a stack. Moving across successive contours means climbing or descending by repeated intervals.
A hill is sliced by horizontal planes at 100, 120, and 140 meters, with guide lines connecting each slice to a nested contour curve below; every point on one curve shares the same height.
Page 2 of 3
Spacing Reveals Steepness
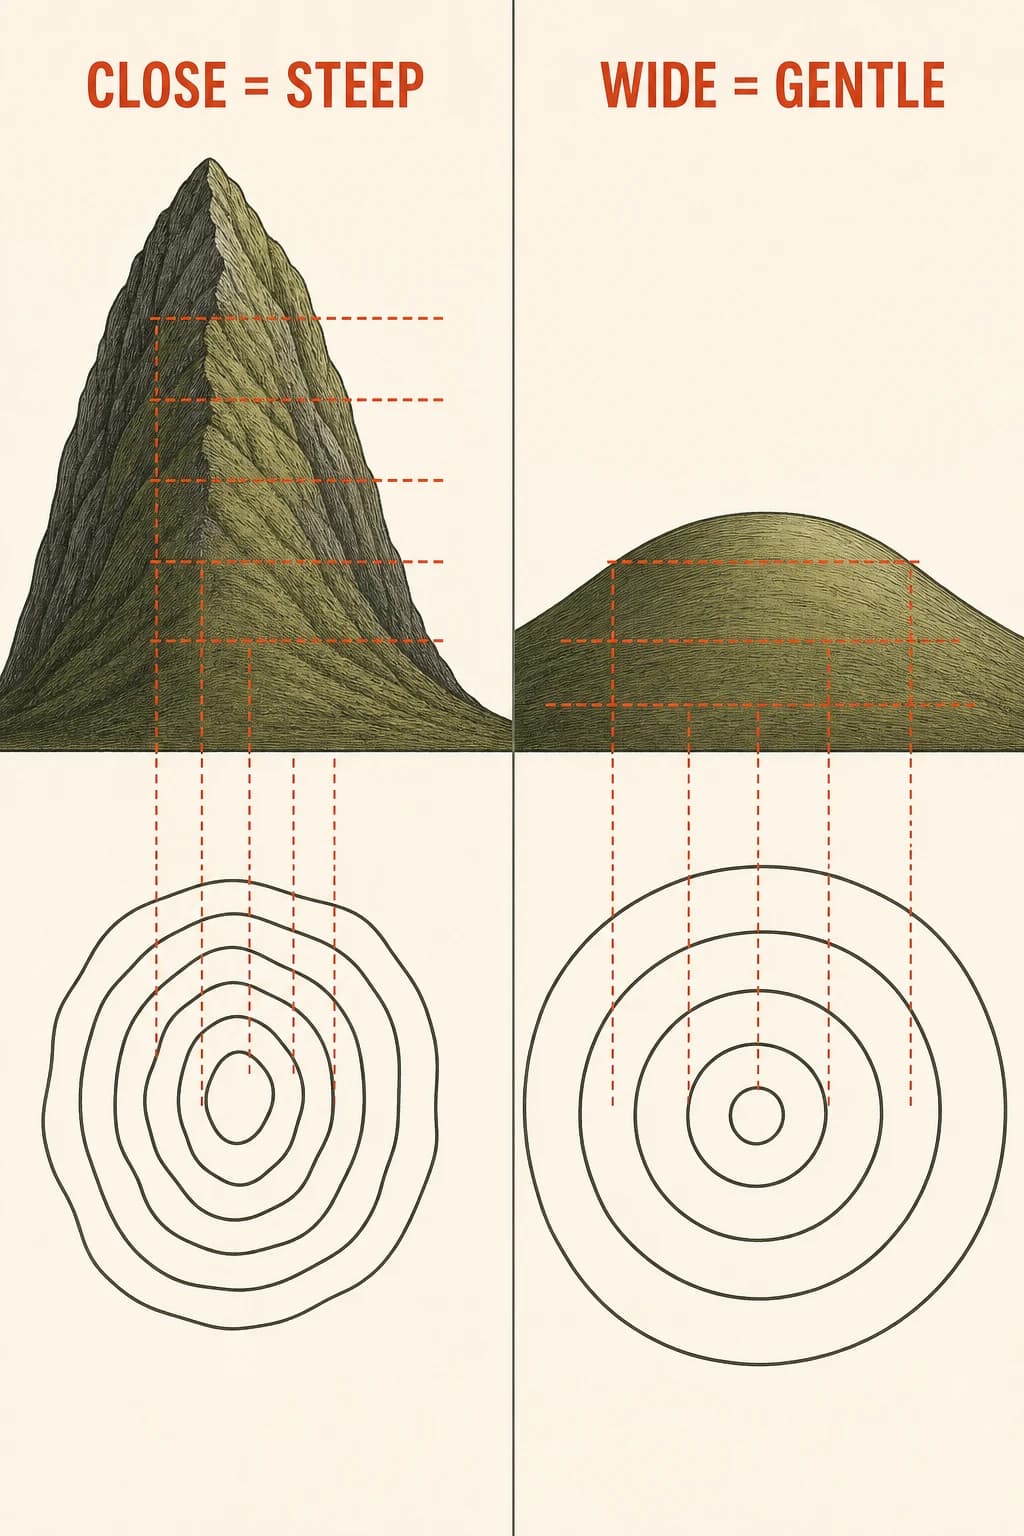
Contour spacing turns horizontal map distance into a clue about slope. When the contour interval is constant, tightly packed lines mean the terrain gains or loses the same amount of height across a short horizontal distance, so the slope is steep. Widely spaced contours spread that vertical change across more ground, so the slope is gentler.
The comparison only works after checking the contour interval and map scale; two maps can use different intervals or scales. On one map, however, the pattern is immediate. A cliff compresses many elevation levels into a narrow band, while a broad hillside gives each level room. You're reading steepness from the relationship between vertical steps and horizontal spacing.
A side-by-side comparison uses the same five elevation levels: the steep hill compresses its contour lines close together, while the gentle hill spreads them widely apart.
Page 3 of 3
Bent Lines Expose Valleys and Ridges
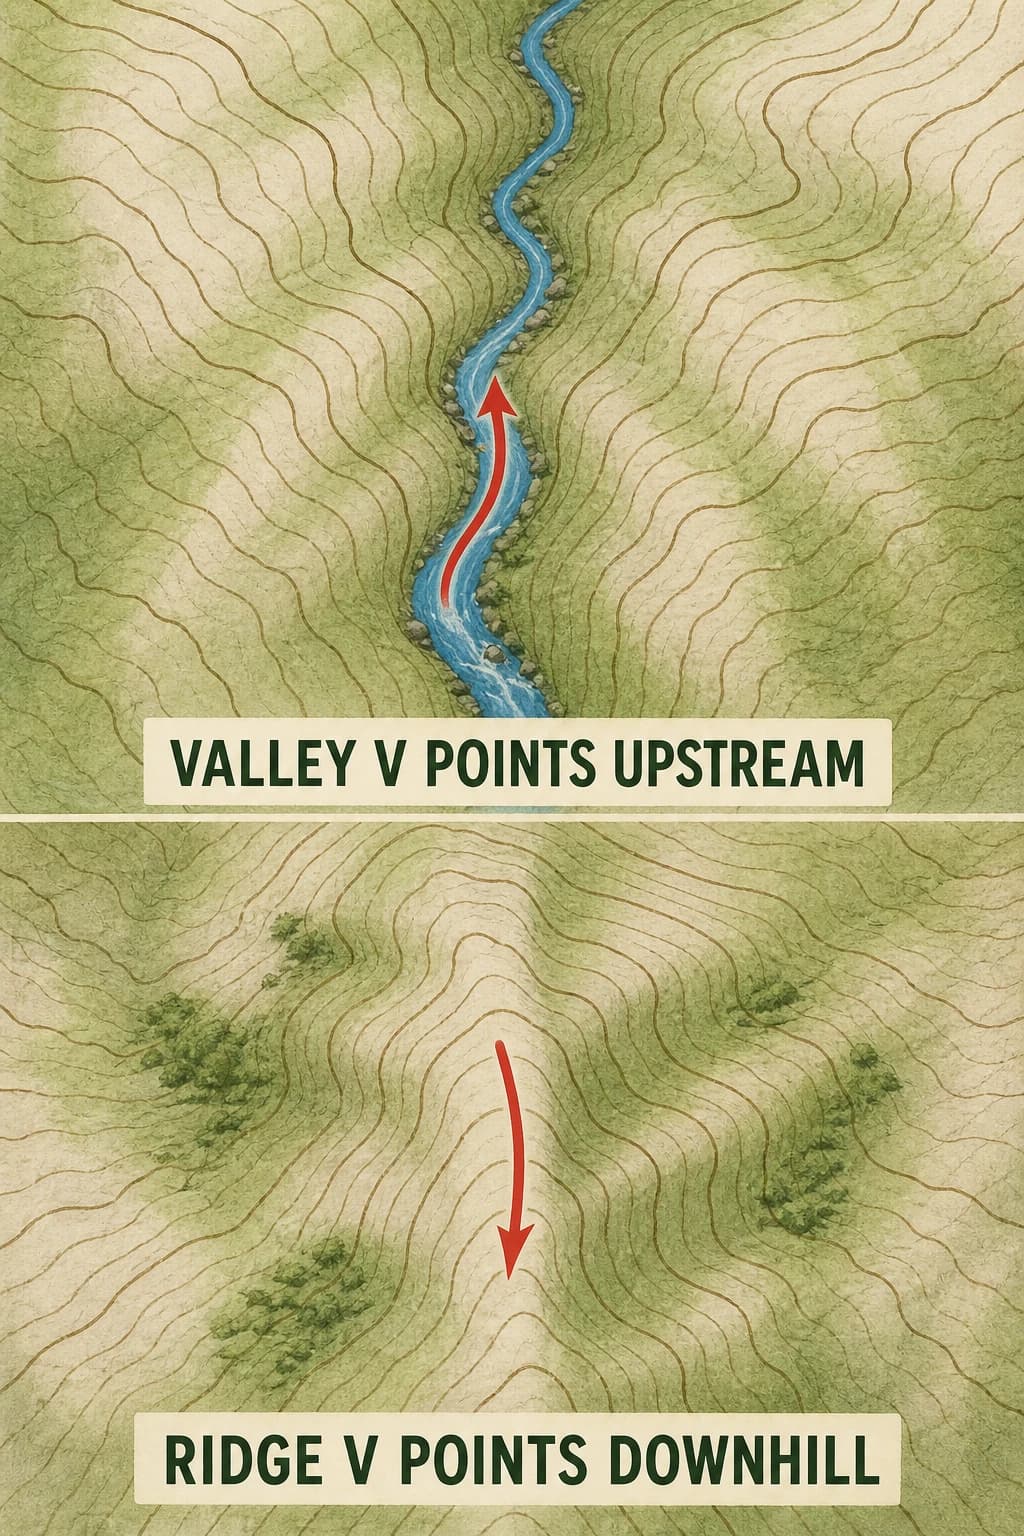
Contour shape adds direction to the height stack. Where contours cross a stream valley, they commonly bend into a V whose point faces upstream, toward higher ground. A ridge produces a related bend pointing downhill. The rule works because a valley floor rises as you follow it toward a stream’s source, while a ridge descends as it extends away from high ground.
You still need the elevation labels and the mapped stream to avoid reading an isolated V backward. Closed loops usually surround a hill when values rise inward; hachured loops are a special symbol for a depression. With those checks, a flat pattern stops looking decorative and becomes a compact model of folds, channels, and divides.
On a contour map, lines crossing a blue stream bend into a V pointing toward the upstream high ground, while contours around a neighboring ridge form a V pointing downhill.
Key takeaways
Every point on one contour line has the same elevation
With a constant interval, closer contours indicate a steeper slope
Valley contours commonly point upstream while ridge contours point downhill
Check your understanding
What does a contour interval measure?
The fixed vertical elevation change between neighboring contour lines.
Why do close contours indicate a steep slope?
The same vertical change occurs across a shorter horizontal distance.
Which direction does the point of a contour V usually face in a stream valley?
Upstream, toward higher ground.
Sources
These references were used to check the important factual claims in this edition.